What to Research Before Buying in Any Neighborhood
 Oleg Tikhonov
Quick Answer
Before buying a home, research the neighborhood across seven core dimensions: safety trends, school attendance zones, local economic health, housing market dynamics, real commute times, flood and environmental risk, and population or household growth.
The goal is not to find a “perfect” neighborhood. The goal is to understand the trade-offs before you spend time touring homes or make an offer on a property.
Neighborhood Research Checklist
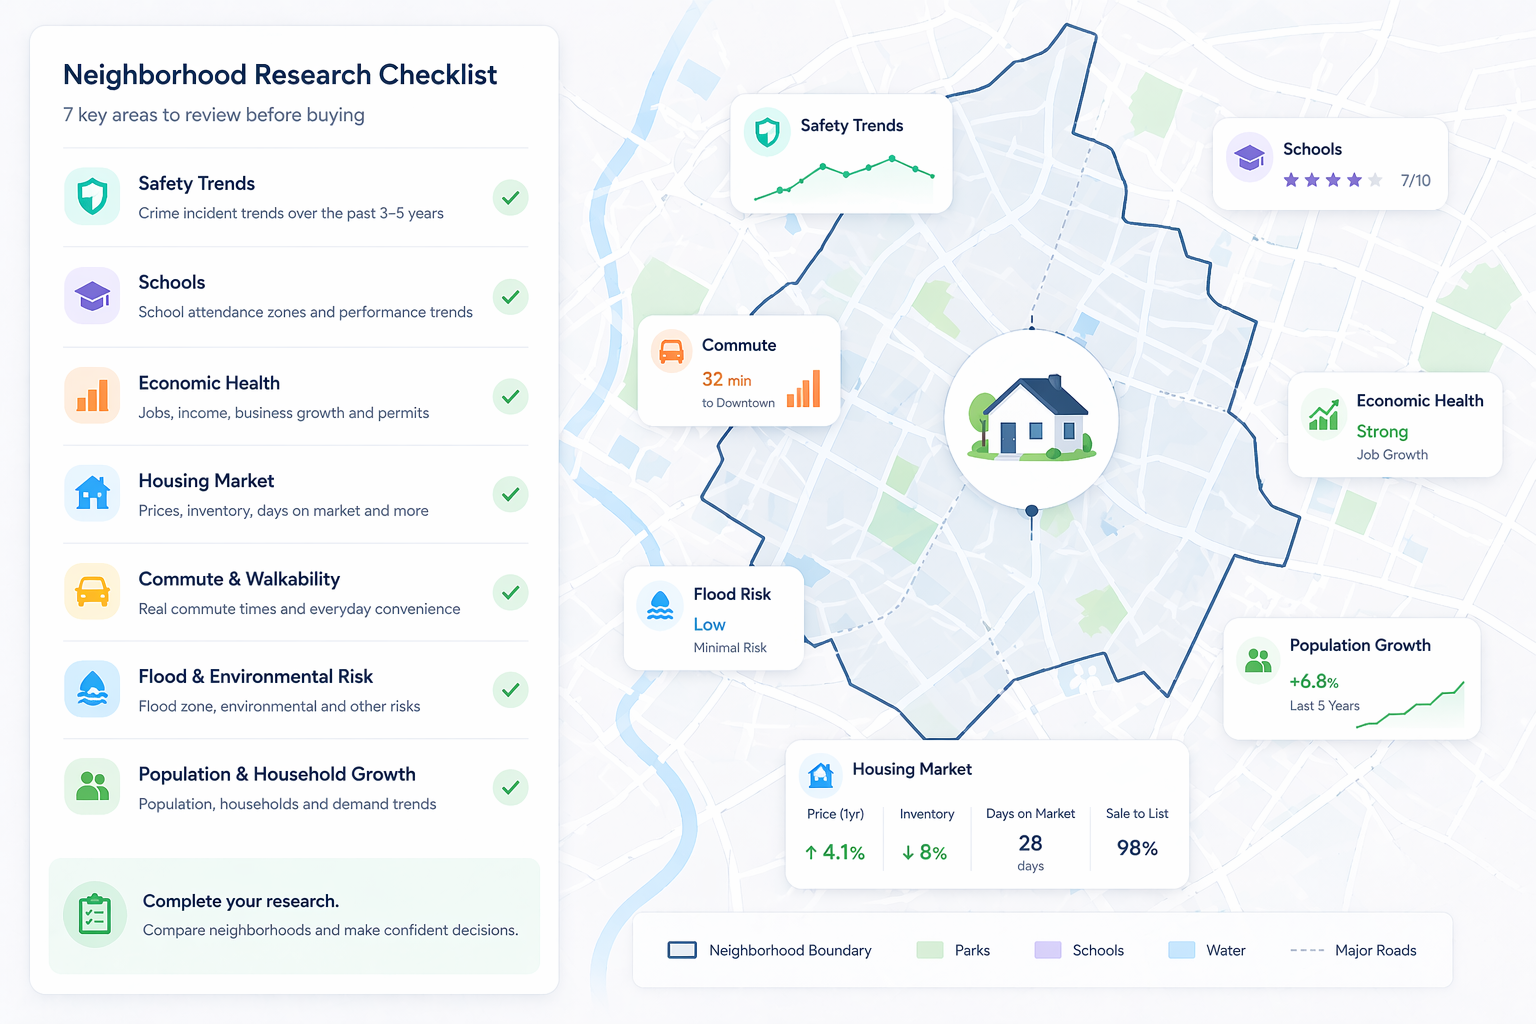
Before you seriously consider a home, check:
- Safety trends: Are reported crime incidents increasing, decreasing, or stable over the past three to five years?
- School attendance zones: Which specific schools is the property zoned for, and have those schools changed over time?
- Economic health: Is the local area gaining jobs, businesses, income, and investment — or losing them?
- Housing market dynamics: Are prices, inventory, days on market, and sale-to-list ratios moving in a healthy direction?
- Real commute times: What does the commute look like during your actual weekday travel window?
- Flood and environmental risk: Is the property in or near a flood zone, industrial site, or other environmental risk area?
- Population and household growth: Is demand for housing in the area expanding, stable, or weakening?
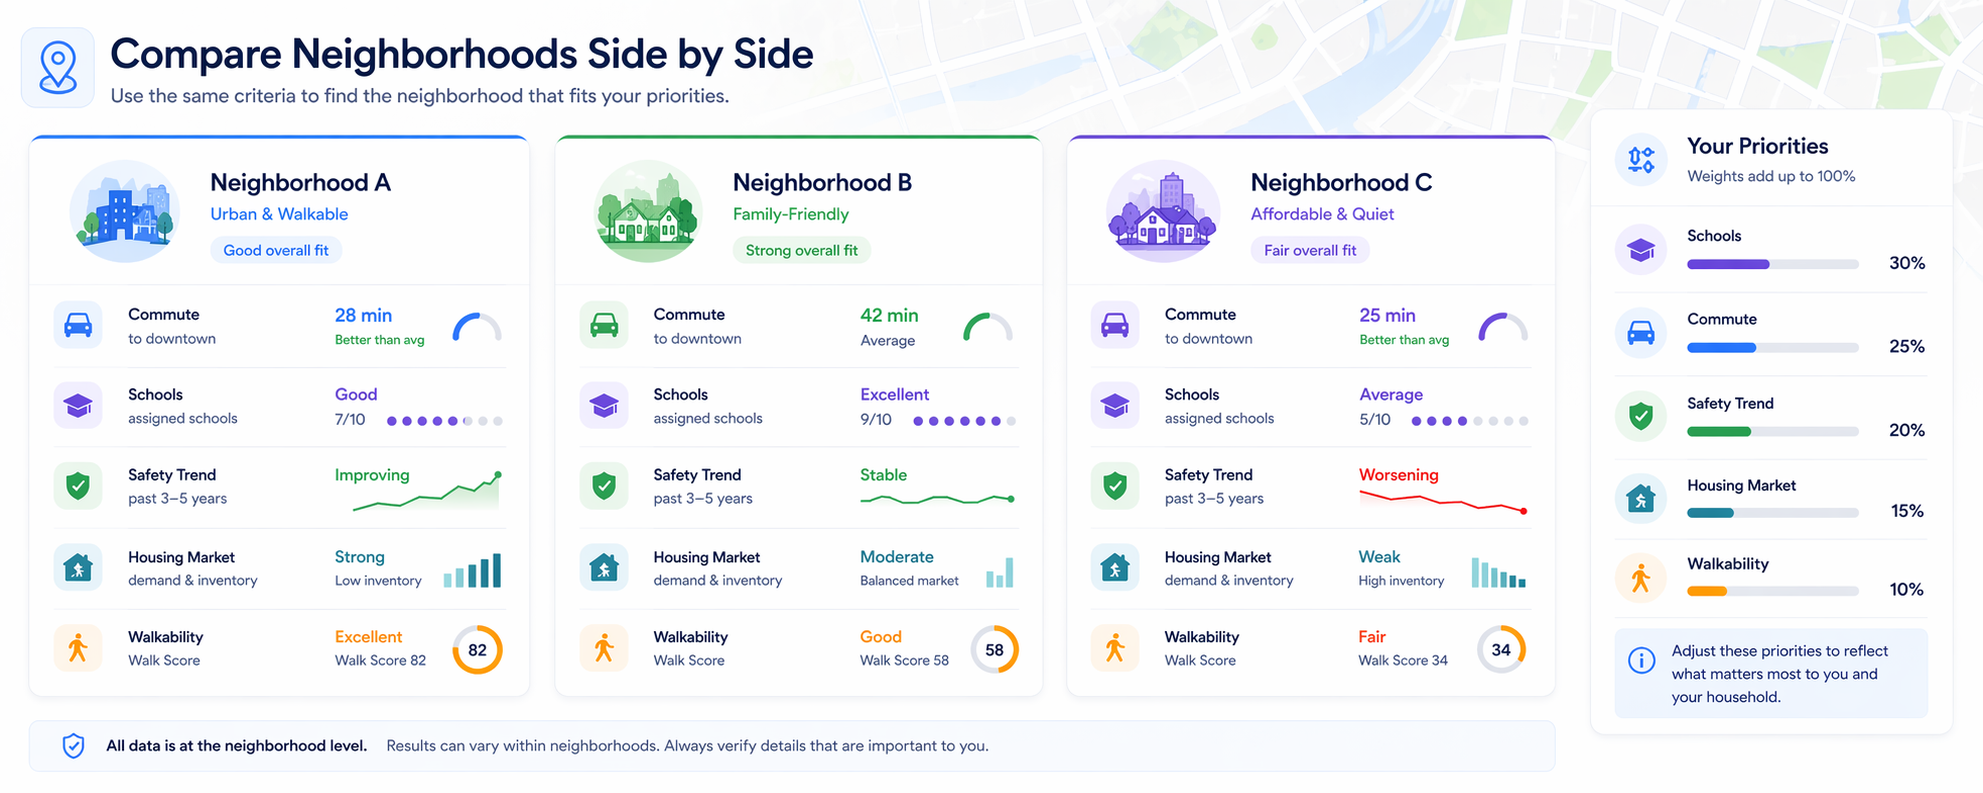
If you are already choosing between two or more areas, see our guide on how to compare neighborhoods side by side. If you are starting from a property listing, read our breakdown of what listings do not tell you about the neighborhood.
Why Neighborhood Research Matters Before You Tour Homes
You can tour a house in 20 minutes. Researching the neighborhood around it takes longer — and often matters more.
A house can be renovated. A roof can be replaced. A kitchen can be remodeled. But the neighborhood — the schools, commute, safety trends, flood exposure, local economy, and buyer demand — is not something you can change after closing.
The problem is that neighborhood data is scattered. Crime statistics may live on a city portal. School boundaries are published somewhere else. Flood maps require a separate lookup. Census and economic indicators are public, but difficult to interpret without context.
So most buyers do one of three things: they rely on listing photos, ask an agent broad questions, or visit the area once on a weekend afternoon. None of those methods is enough.
This guide gives you a structured checklist for researching any neighborhood before you decide whether a home is worth pursuing.
1. Safety Trends Over Time
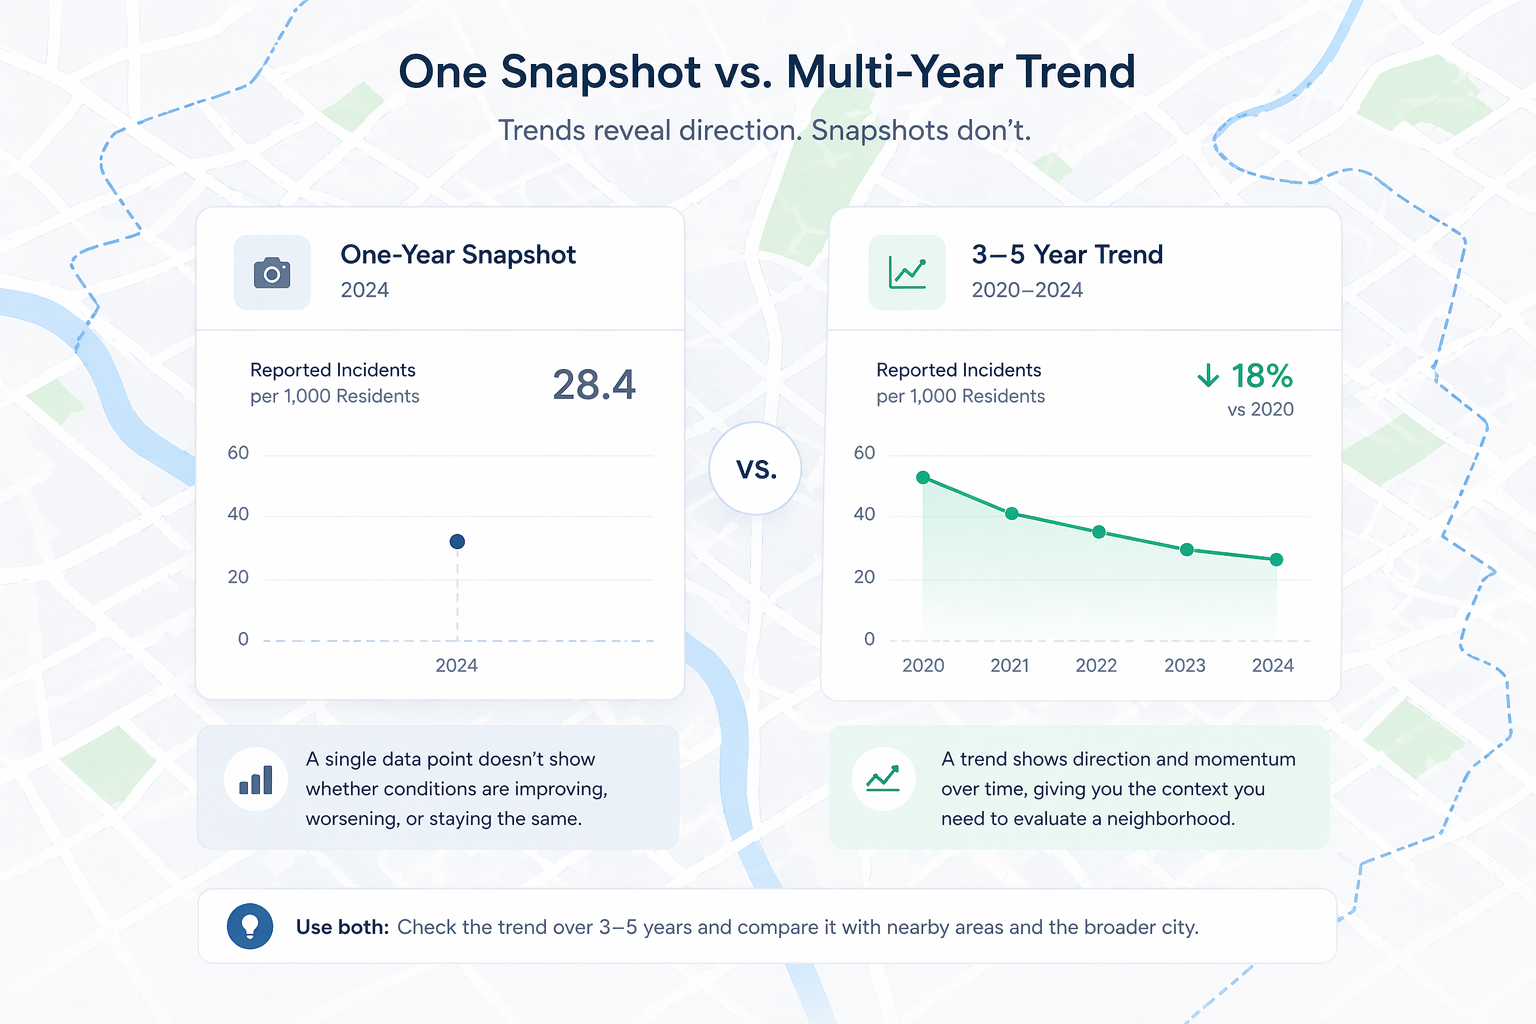
The most important word here is "trends."
A single crime statistic — incidents per 1,000 residents, for example — tells you very little without context. What you want to know is the direction: are reported incidents in this neighborhood increasing, decreasing, or holding steady over the past three to five years?
Trend direction gives you context that a single-year statistic cannot. A neighborhood with moderate crime levels but improving trends may deserve a different evaluation than one with slightly lower current numbers but worsening trends.
What to research:
- Reported property crime incidents per 1,000 residents
- Reported violent crime incidents per 1,000 residents
- Year-over-year trend over three to five years
- Whether nearby areas show similar or different patterns
- Whether the data source is city-level, precinct-level, neighborhood-level, or block-level
Where to look:
- City open-data portals
- Local police department annual reports
- FBI Uniform Crime Reporting data
- County or municipal crime dashboards, where available
What to avoid:
- Single-year statistics without trend context
- Vague neighborhood reputation
- Online forum posts as a primary source
- Anecdotes from one or two residents
Anecdotes can be useful for context, but they are not a substitute for trend data. The question is not whether someone had a good or bad experience. The question is what the reported data shows over time.
2. School Quality at the Block Level
Do not rely only on the school district name.
The relevant question is which specific school attendance zone the property belongs to today — and whether that boundary has changed or may change again.
School quality can vary significantly within a single district, and sometimes even within a single ZIP code. Two houses a few miles apart may be zoned for different elementary, middle, or high schools. Those differences can affect family decisions, buyer demand, and future resale dynamics.
What to research:
- The specific school attendance zone for the property
- The elementary, middle, and high schools assigned to that address
- School rating history over the past several years
- State test score trends
- Recent or proposed attendance boundary changes
- Whether the district has overcrowding, rezoning, or school capacity issues
Where to look:
- School district attendance boundary maps
- GreatSchools
- State department of education data
- National Center for Education Statistics
- Local school board meeting records, if boundary changes are being discussed
School access can affect future buyer demand, especially among households that prioritize education. Even if you do not have children, it is still useful to understand how school boundaries shape the local housing market.
The key is to evaluate the specific schools tied to the property, not the district average.
3. Economic Health of the Local Area
Neighborhood economic health is a leading indicator of how an area may change over time.
Ask one simple question: is this area attracting investment, jobs, and households — or slowly losing them?
An area gaining employers, new businesses, income growth, and private investment tends to support services, retail, infrastructure, and housing demand. An area losing jobs or businesses may face the opposite pressure, though the effect may take time to show up in housing prices.
What to research:
- Local unemployment rate relative to the metro average
- Median household income trends
- Business formation and closure trends
- Major employer expansions, contractions, or relocations
- Building permit activity
- Commercial vacancy trends, where available
Where to look:
- Bureau of Labor Statistics
- Census American Community Survey
- City or county economic development reports
- Local chamber of commerce reports
- Building permit databases
- Local news coverage of major employer activity
One underused signal is permit activity. Cities that publish building permit data let you see whether new construction and renovation are concentrated in a given area. That can serve as a proxy for private investment confidence.
Economic data is rarely visible during a home tour, but it shapes what services, employers, renters, buyers, and future investment may show up around the neighborhood.
4. Housing Market Dynamics
Understanding the local housing market means more than looking at the current listing price.
You need to understand price trends over time, the pace at which homes are selling, and how this specific neighborhood compares to adjacent ones.
Do not look at price alone. A rising median price can mean healthy demand, but it can also mean the area has already absorbed much of its near-term upside. That is why price trends should be read together with inventory, days on market, and sale-to-list ratios.
What to research:
- Median home price trend over three, five, and ten years
- Days on market
- Sale-to-list price ratio
- Months of supply
- Number of active listings
- Number of closed sales
- Price trends compared with nearby neighborhoods
- Price trends compared with the broader metro area
Where to look:
- County property records
- County assessor databases
- MLS-derived market reports, where available
- Public real estate data aggregators
- Local realtor association reports
What to watch for:
- Prices rising while inventory also rises
- Days on market increasing after a period of rapid appreciation
- A neighborhood significantly outperforming the metro without supporting economic signals
- A neighborhood with stable pricing but improving fundamentals
A neighborhood with 4% annual appreciation and tight inventory tells a different story than one with 6% appreciation but rising days on market and growing supply.
The point is not to predict the market perfectly. The point is to understand whether the neighborhood’s housing data supports the story you are telling yourself about the area.
5. Commute and Walkability: Real Numbers, Not Estimates
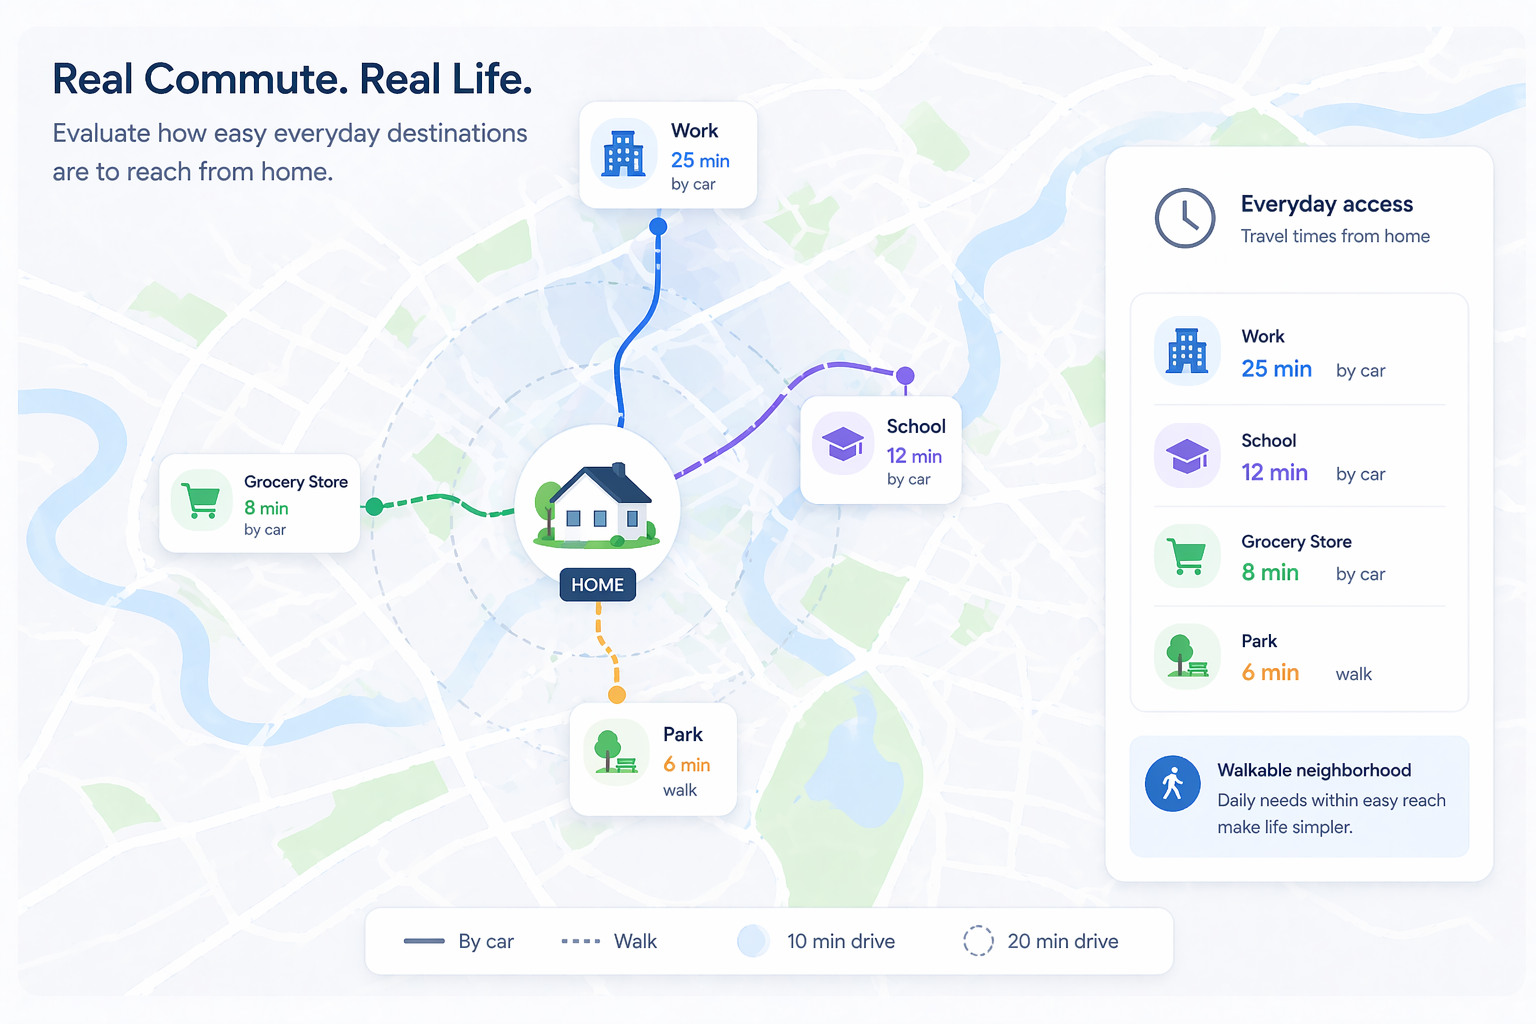
The average buyer dramatically underestimates how much daily commute affects quality of life.
Commute is not just a convenience factor. It is a recurring cost paid in time, stress, schedule flexibility, and family life.
A neighborhood that looks 25 minutes from work on a Sunday afternoon may be 50 minutes away on a Tuesday morning. That difference compounds across hundreds of commutes per year.
What to measure:
- Drive time during your actual weekday departure window
- Return commute during your actual evening window
- Public transit time, including walking and waiting
- Transfer frequency and reliability
- Walk Score
- Transit Score
- Bike Score, if relevant
- Distance to daily essentials such as groceries, healthcare, parks, and schools
How to test it:
- Use Google Maps or Apple Maps during live traffic conditions
- Check both morning and evening commute windows
- Use the same time and destination when comparing neighborhoods
- If possible, drive the route yourself before making an offer
Also consider commute asymmetry. Traffic patterns in many cities mean the morning commute and the return trip can differ substantially. Measure both.
Walkability matters for the same reason: it affects daily life. A home may look affordable on paper but become more expensive in practice if every errand requires a car, every commute is long, and every routine task consumes more time than expected.
6. Flood Zones and Environmental Risk
Flood and environmental risk are among the most commonly overlooked categories in neighborhood research.
Flood risk is often not obvious from the listing itself, and disclosure rules vary by state, property history, and transaction context. That makes independent lookup important.
Flood risk is not only about whether water reached the property in the past. It can affect insurance cost, lender requirements, future resale friction, and the number of buyers willing to consider the home.
What to research:
- FEMA flood zone designation
- Whether flood insurance may be required by a lender
- Whether the area has recent flood history
- Whether FEMA maps are current or outdated
- Elevation and drainage patterns
- Nearby canals, rivers, lakes, coastlines, or low-lying areas
- Proximity to industrial sites
- Proximity to Superfund sites
- Air quality or environmental exposure concerns, where relevant
Where to look:
- FEMA Flood Map Service Center
- Local floodplain management office
- County property records
- EPA ECHO database
- EPA Superfund site search
- Local environmental agency data
- Local stormwater or drainage maps, where available
Pay attention to the difference between high-risk zones and moderate-risk zones. Also note whether the flood map for the area has been updated recently. FEMA maps are updated on irregular schedules, and some areas may have outdated designations.
Environmental risk is not always obvious during a home tour. A quiet street can still be near an industrial site, landfill, contamination area, or flood-prone corridor. These factors can affect quality of life, insurance, financing, and future resale.
7. Population and Household Growth
Population trends show whether an area is expanding, stable, or shrinking.
But for homebuyers, household growth is often even more useful than raw population growth.
Population growth tells you how many people live in an area. Household growth tells you how many housing units are needed. For homebuyers, household growth is often the more useful signal because households — not individuals — create housing demand.
What to research:
- Population change over time
- Household count change over time
- Owner-occupied vs. renter-occupied housing trends
- Vacancy rates
- Median household size
- New housing units permitted or built
- Whether growth is concentrated in families, single-person households, retirees, or renters
Where to look:
- Census American Community Survey
- Census tract-level data
- Local planning department reports
- Building permit databases
- Regional planning agency reports
Areas with growing households generally support stronger housing demand, services, and retail options. Areas with declining household formation may face weaker demand, even if the current housing market still looks stable.
Building permit data is useful here because population data is lagged. Permits can show where developers are placing bets today, while Census data often tells you what already happened.
How to Use This Checklist
You do not need perfect data before considering a neighborhood. But you should avoid making a decision based on one attractive listing, one weekend visit, or one person’s opinion.
A practical approach:
- Use this checklist to eliminate neighborhoods that clearly fail your non-negotiables.
- Compare the remaining neighborhoods across the same categories.
- Look for trade-offs, not perfection.
- Revisit the data before making an offer, especially if the property is in a flood-prone, school-sensitive, or rapidly changing area.
The goal is not to replace your agent, lender, inspector, or attorney. The goal is to enter the buying process with a clearer understanding of the neighborhood-level risks and trade-offs.
A good neighborhood decision is rarely based on one metric. It usually comes from seeing multiple signals together.
Putting It Together
None of these categories exist in isolation.
A neighborhood with strong school access, improving safety trends, growing household demand, manageable commute times, and limited flood exposure is a fundamentally different choice than one that looks similar in listing photos but lacks those underlying conditions.
The challenge is that each data source requires a separate lookup, uses different methodologies, and presents results in formats that are difficult to compare.
Most buyers do not skip this research because they do not care. They skip it because the friction is high, the sources are scattered, and the home-buying process becomes emotional quickly.
Once you collect this data, the next step is comparison. A neighborhood rarely wins or loses in isolation — it wins relative to your other options. That is why the same research framework should be applied consistently across every area you are considering.
Research the Neighborhood Before You Fall in Love With the House
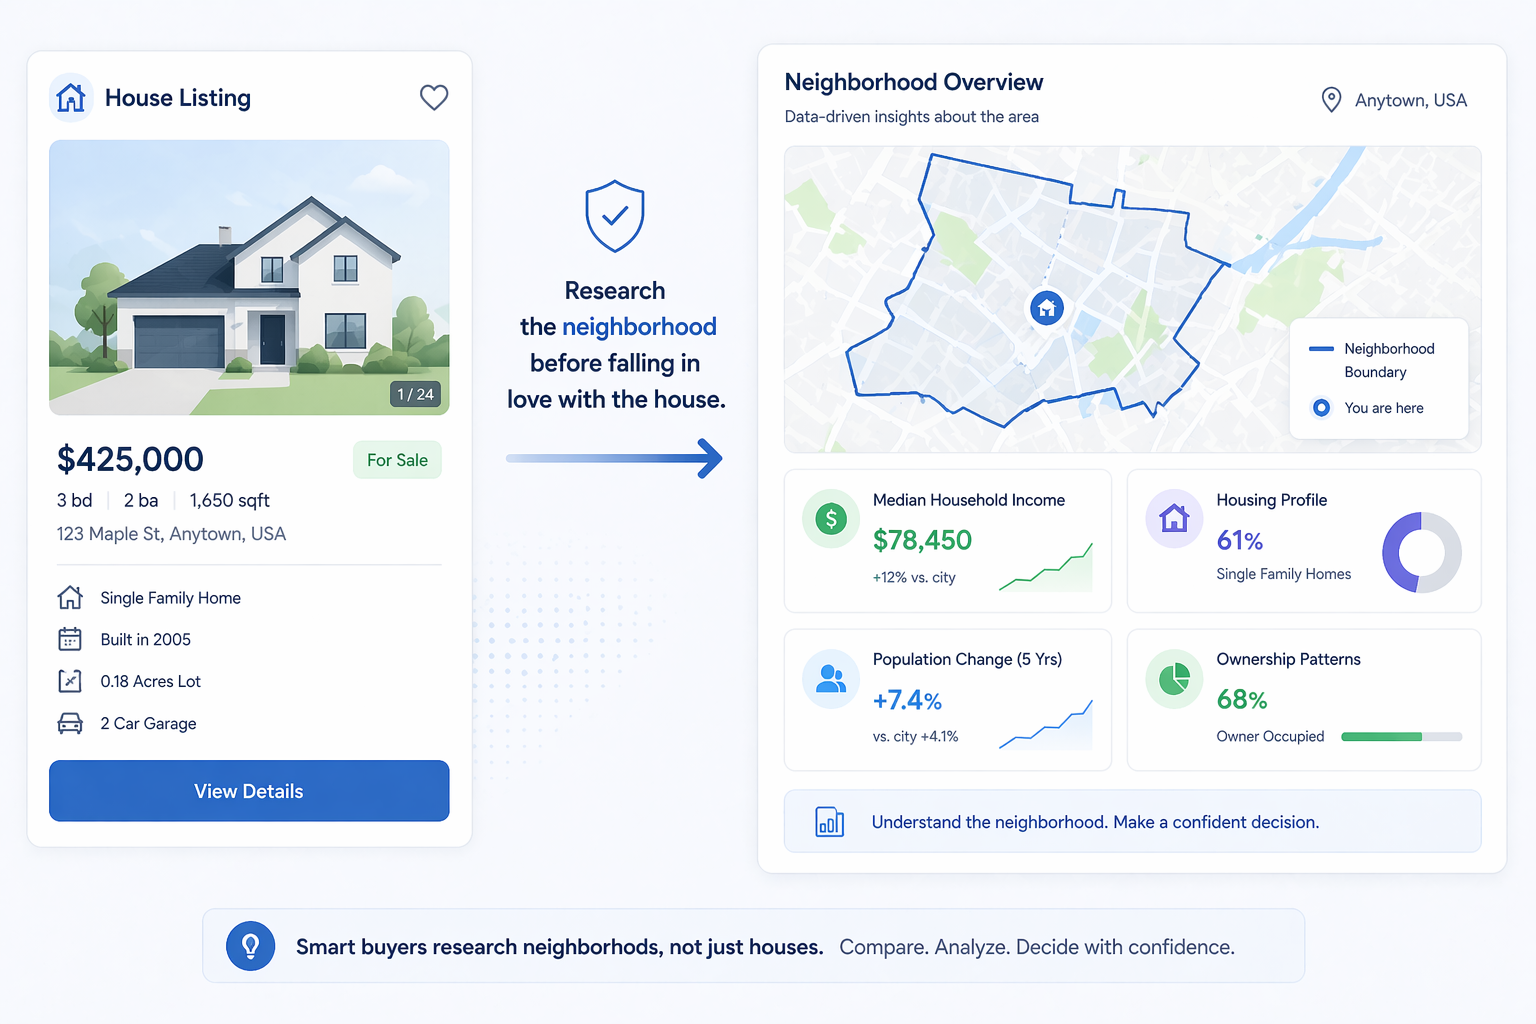
Most real estate tools start with the listing. Settilo starts one step earlier: with the neighborhood.
Settilo brings public neighborhood data into one place so buyers can review key signals — income, housing profile, population change, ownership patterns, and other neighborhood-level indicators — before spending time on homes that may not fit their real priorities.
The data is public. The hard part is finding it, normalizing it, and comparing it before the decision becomes emotional.