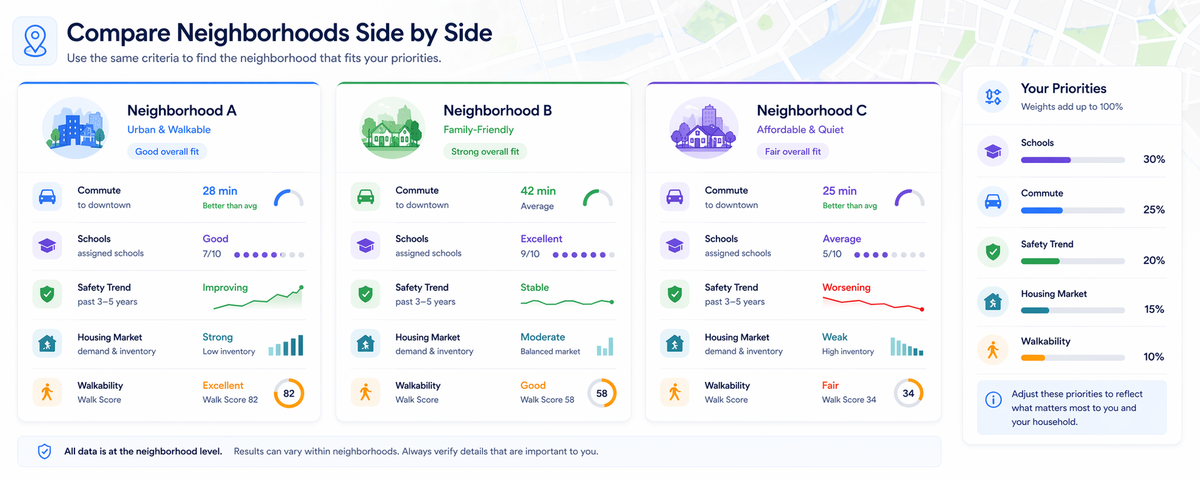
How to Compare Neighborhoods Side by Side Before Buying a Home
 Oleg Tikhonov
Quick Answer
To compare neighborhoods effectively, use the same criteria for each area, define your priorities before looking at the data, separate non-negotiables from preferences, and compare trade-offs side by side.
The goal is not to find the neighborhood with the highest score. The goal is to understand which neighborhood best fits your actual priorities before you spend more time touring homes.
Why Neighborhood Comparison Should Be Structured
Rating a neighborhood in isolation tells you relatively little. The more useful question is: compared to what?
Most buyers are not choosing from every neighborhood in a city. They are choosing between a small set of realistic options: this area or that one, these schools or those, this commute or that price range.
The problem is that most buyers do not structure the comparison explicitly. They visit multiple neighborhoods on different weekends, form general impressions, and try to hold it all in their head while the specific details blur together.
That is where comparison breaks down.
A structured neighborhood comparison does not make the decision for you. It helps you compare the same factors across each area, using the same method, so the real trade-offs become visible.
This guide shows how to compare neighborhoods side by side using consistent criteria, personal priorities, non-negotiables, and trade-off analysis.
Step 1: Start With Your Real Options
Before comparing neighborhoods, define the actual set of areas you are considering.
Most buyers make one of two mistakes:
- They compare too many neighborhoods and get overwhelmed.
- They compare one favorite neighborhood against vague alternatives.
A useful comparison usually includes two to five realistic options. These should be neighborhoods you could actually consider based on location, budget, commute, housing type, and general fit.
For each neighborhood, write down why it is on the list.
For example:
| Neighborhood | Why it is being considered |
|---|---|
| Neighborhood A | Better commute and walkability |
| Neighborhood B | Stronger school access |
| Neighborhood C | More affordable homes |
| Neighborhood D | Closer to family or work |
This first step prevents the comparison from becoming abstract. You are not trying to evaluate every possible neighborhood. You are trying to make a decision between real options.
Step 2: Define Non-Negotiables Before You Compare
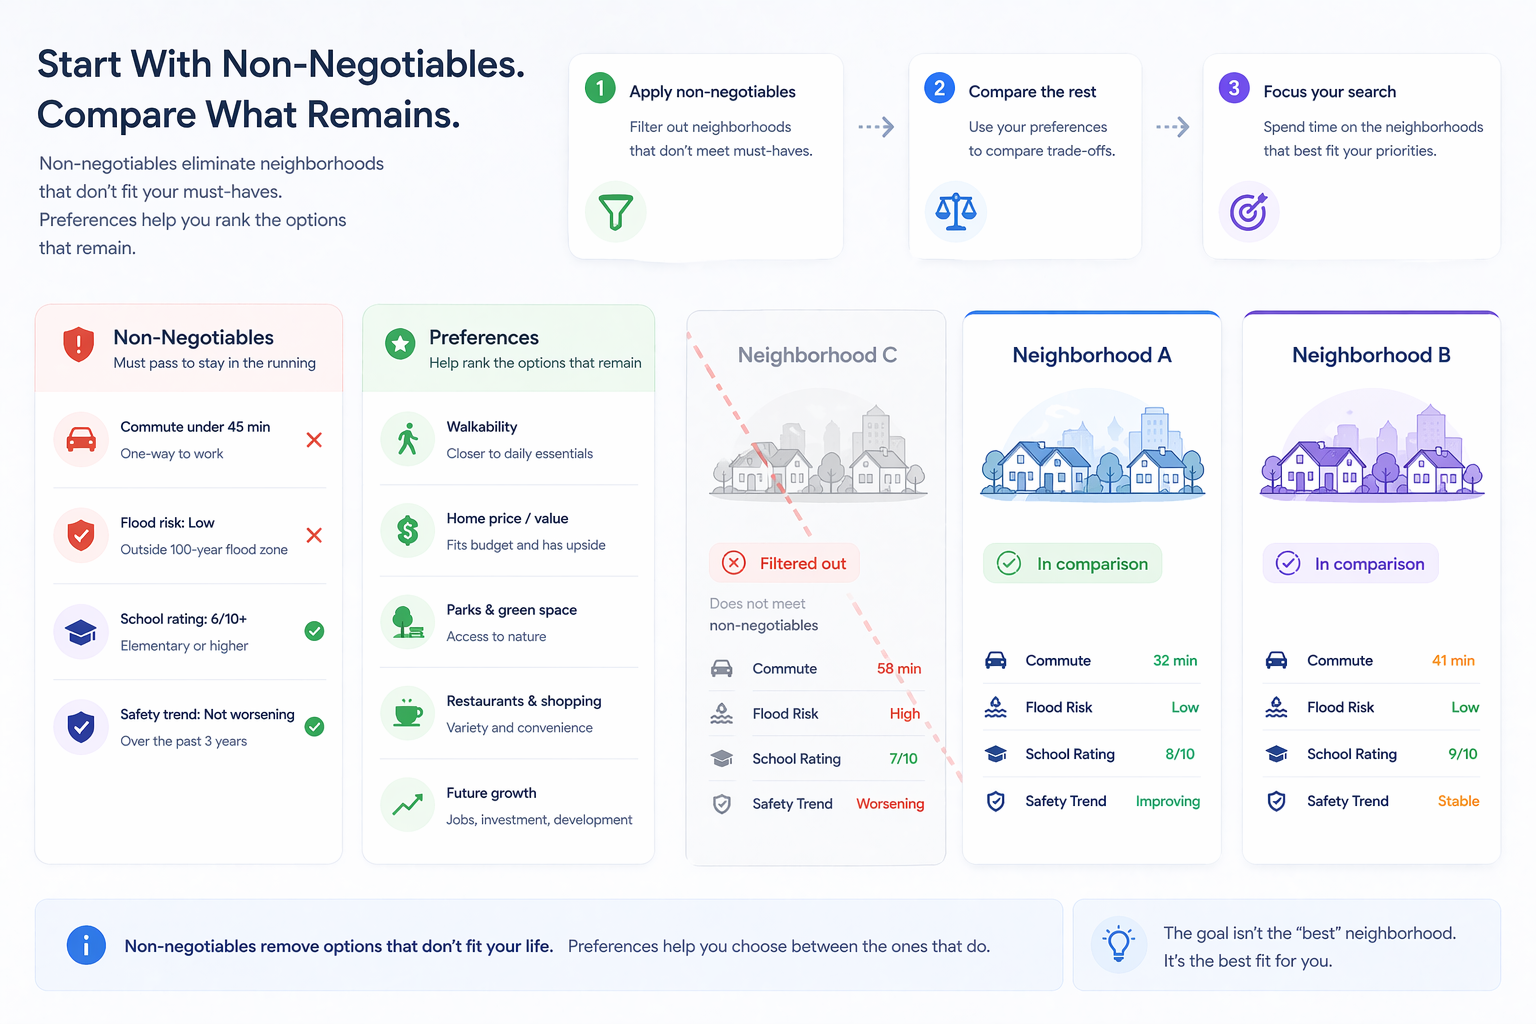
The biggest mistake in neighborhood comparison is treating all factors equally.
They are not equal for every buyer.
A non-negotiable is not the same as a preference.
A non-negotiable eliminates a neighborhood. A preference helps rank neighborhoods that remain after elimination.
For example:
- "Commute under 45 minutes" can be a non-negotiable.
- "Walkable to restaurants" may be a preference.
- "Best possible school access" may be a strong preference.
- "Close to nightlife" may be irrelevant for some buyers.
Before pulling data, answer three questions:
- What is my non-negotiable?
This is the factor that eliminates a neighborhood if it fails, regardless of how well it performs elsewhere. - What are my two or three strong preferences?
These are factors that matter a lot, but that you could trade against each other. - What am I mostly indifferent to?
These are factors you may still review, but they should not drive the decision.
Writing this down before looking at data forces discipline. It prevents you from reverse-engineering priorities to justify a neighborhood you have already emotionally chosen.
Do not let a strong preference override a true non-negotiable. That is how buyers end up justifying a neighborhood that does not actually fit their life.
Step 3: Use the Same Criteria for Every Neighborhood
The comparison only works if each neighborhood is evaluated using the same categories and the same method.
If you check commute carefully for one neighborhood but only estimate it for another, the comparison becomes unreliable. If you review school attendance zones for one area but only look at district averages for another, you are no longer comparing the same thing.
Use the same dimensions across every neighborhood:
| Dimension | What to compare | Use the same method? |
|---|---|---|
| Safety trends | Direction of reported incidents over three to five years | Yes — same source and time period |
| Schools | Specific attendance-zone schools, not district averages | Yes — same school level and data source |
| Local economy | Income trend, employment, permits, business activity | Yes — compare against the same metro baseline |
| Housing market | Price trend, inventory, days on market, sale-to-list ratio | Yes — same time window |
| Daily life | Commute, walkability, transit, access to essentials | Yes — same commute time and destination |
| Flood and environmental risk | Flood zones, insurance implications, nearby environmental risks | Yes — confirm at the same level of detail |
If you need a full checklist of what to research before buying in a neighborhood, start with a neighborhood research checklist first. This article focuses on what to do after you have multiple neighborhoods to compare.
Step 4: Build a Side-by-Side Comparison Table
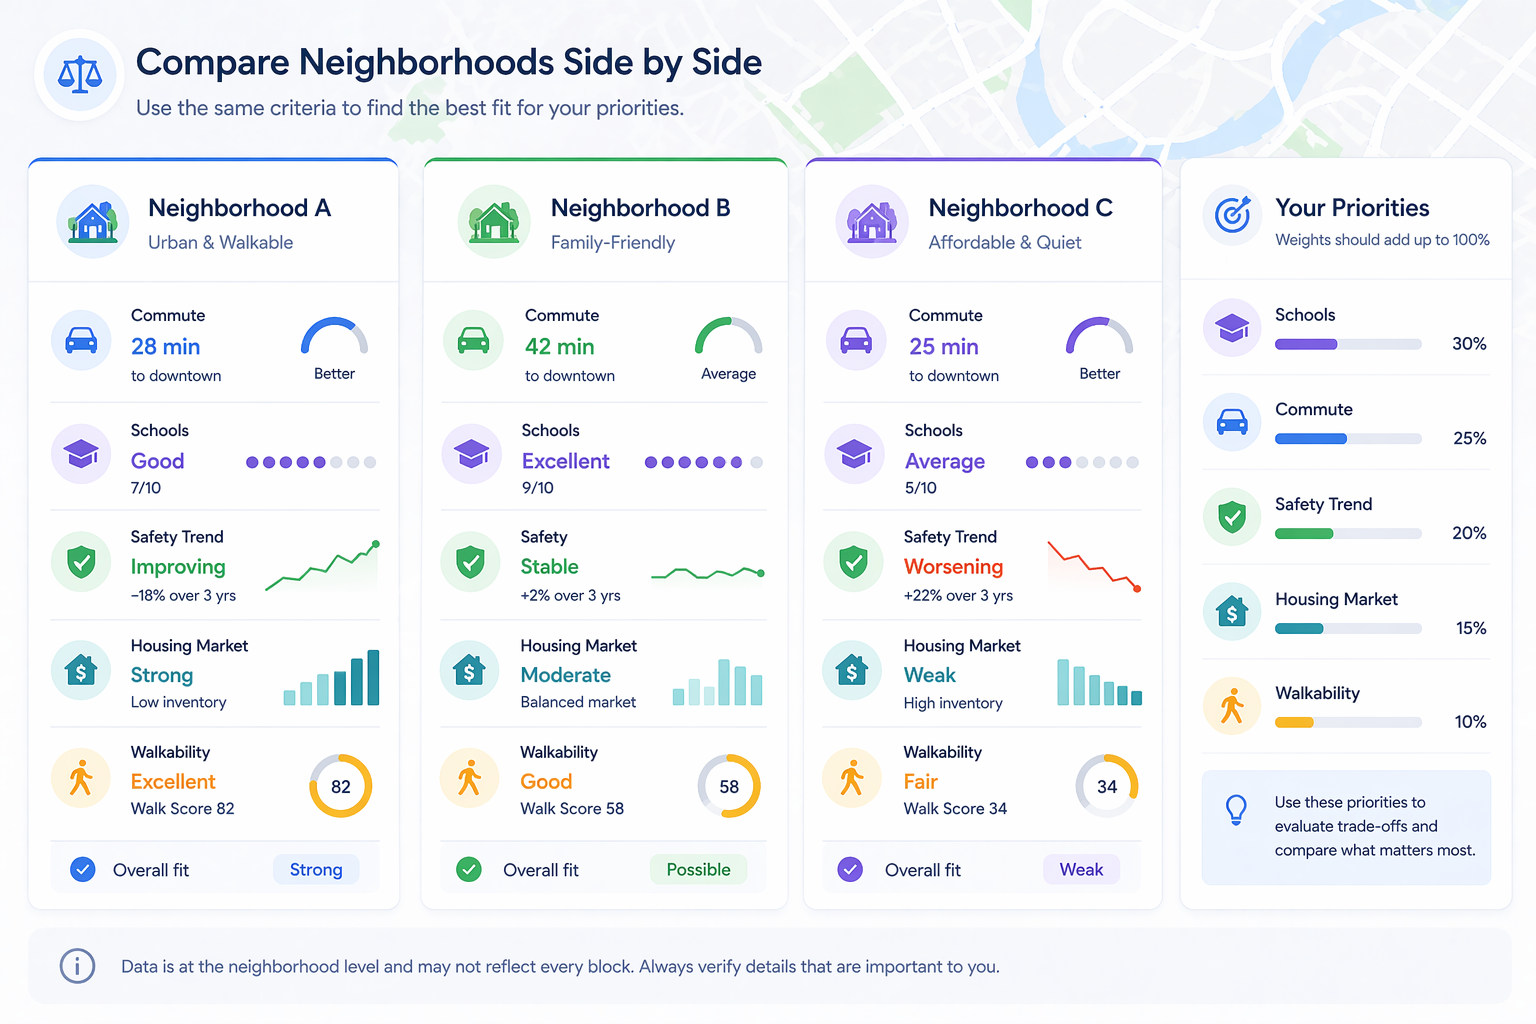
A simple comparison table is often more useful than a long list of notes.
The goal is to stop comparing one neighborhood’s best feature against another neighborhood’s worst feature. Put the same factors next to each other and force the trade-offs into view.
Here is a basic structure:
| Factor | Neighborhood A | Neighborhood B | Neighborhood C | Notes |
|---|---|---|---|---|
| Non-negotiable passed? | Yes | No | Yes | Eliminate any area that fails a true non-negotiable |
| Safety trend | Improving | Stable | Worsening | Use same data source and time period |
| Assigned schools | Stable | Stronger | Mixed | Use specific attendance zones |
| Commute | 32 min | 48 min | 27 min | Same weekday/time/destination |
| Housing market | Tight inventory | Higher days on market | Moderate | Compare against metro average |
| Flood/environmental risk | Low | Moderate | Low | Confirm property-level risk separately |
| Overall fit | Strong | Weak | Possible | Based on your priorities, not a generic score |
The point is not to make the decision mechanical. The point is to make the comparison honest.
If a neighborhood fails a non-negotiable, it should not stay in the running just because it performs well in a less important category.
Step 5: Apply Weights Without Pretending the Score Is Perfect
Weights can help you think clearly, but they should not pretend to produce a scientifically perfect answer.
A simple method is to assign each dimension a weight that adds to 100, then rate each neighborhood from 1 to 5 on each dimension.
For example:
| Dimension | Weight | Neighborhood A | Neighborhood B |
|---|---|---|---|
| Schools | 30% | 3/5 | 5/5 |
| Commute | 25% | 5/5 | 2/5 |
| Safety trend | 20% | 4/5 | 4/5 |
| Housing market | 15% | 4/5 | 3/5 |
| Walkability | 10% | 5/5 | 2/5 |
This kind of score is not a recommendation. It is a way to surface trade-offs.
If a neighborhood scores higher overall but fails your non-negotiable, the score should not save it.
That is the most important rule of weighted comparison: the number is a tool for thinking, not a substitute for judgment.
Step 6: Read the Trade-Offs, Not Just the Total Score
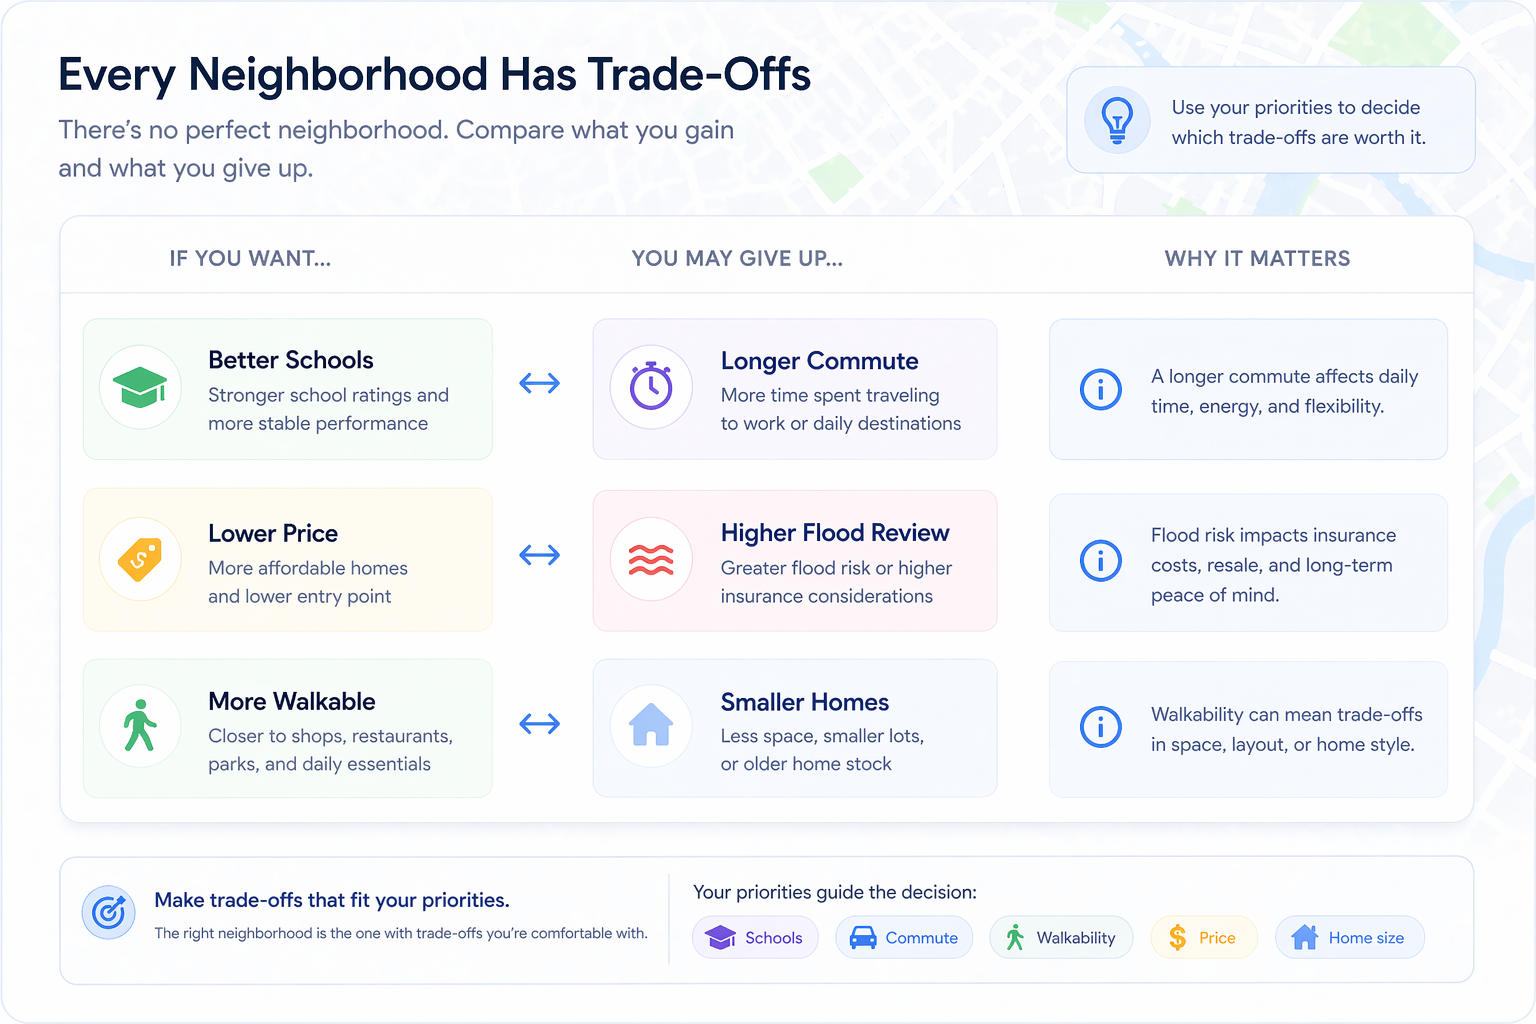
The best neighborhood comparison does not simply produce a winner. It reveals the cost of each choice.
One area may offer better school access but a longer commute. Another may offer stronger walkability but weaker housing value trends. A third may be more affordable but carry higher flood or insurance risk.
That is the real value of comparison: it shows what you are giving up, not only what you are getting.
A good comparison should make trade-offs visible enough that you can say:
- "This area is better for daily life, but weaker for resale demand."
- "This area is better for schools, but worse for commute."
- "This area is cheaper, but the flood and insurance risk need more review."
- "This area looks good emotionally, but does not match our stated priorities."
The right neighborhood is rarely perfect across every dimension. More often, it is the one that clears your non-negotiables and creates the fewest unacceptable trade-offs.
Example: Two Neighborhoods, Two Different Buyers
Consider two hypothetical neighborhoods in the same metro area.
| Factor | Neighborhood A | Neighborhood B |
|---|---|---|
| Walk Score | 82 | 54 |
| Commute | 28 minutes | 46 minutes |
| School rating trend | Stable, mid-rated | Improving, higher-rated |
| Safety trend | Improving | Stable |
| Housing appreciation | 5% annually over five years | 3% annually over five years |
| Economic signal | Metro average | Major employer expansion nearby |
For a buyer who works from home, has no children, and values walkability, Neighborhood A may fit the stated priorities better.
For a family that prioritizes school access and views the employer expansion as a long-term signal, Neighborhood B may fit better.
The data did not produce one universal answer. It clarified which neighborhood better fits which buyer.
That is what a good comparison should do.
It should not tell every buyer to choose the same neighborhood. It should help each buyer understand which trade-offs match their actual life.
Common Mistakes When Comparing Neighborhoods
Comparing neighborhoods on different days or times
A commute tested on Sunday afternoon is not comparable to one tested Tuesday at 8am.
Use the same weekday, time window, destination, and transportation mode for each neighborhood.
Comparing one neighborhood’s strengths to another’s weaknesses
Buyers often compare the best feature of one area against the worst feature of another.
For example, they may compare Neighborhood A’s best school to Neighborhood B’s average commute, or Neighborhood B’s lower price to Neighborhood A’s worst traffic day.
Use the same categories for each area.
Changing priorities after seeing the data
If you redefine your priorities after falling in love with a neighborhood, the comparison stops being useful.
Set your priorities first. Then review the data.
Treating the final score as the decision
A score can organize your thinking, but it cannot decide for you.
Non-negotiables and trade-offs matter more than a total number.
Ignoring “good enough” neighborhoods
The right neighborhood is not always the one that wins every category.
Often it is the one that clears your non-negotiables, fits your strongest preferences, and avoids the trade-offs you would regret most.
Compare Neighborhoods Before You Tour More Homes
Most real estate tools start with listings. But by the time you are comparing individual homes, you may already be too deep into the wrong areas.
Settilo helps buyers compare neighborhoods earlier in the process, using public neighborhood-level data and side-by-side context. Instead of jumping between separate sources and trying to remember scattered details, buyers can evaluate areas in a more structured way before focusing on specific homes.
The framework is simple: define your priorities, compare the same signals, surface the trade-offs, and decide which neighborhoods deserve more attention.
The goal is not to find a perfect neighborhood. The goal is to avoid spending time, money, and emotional energy on neighborhoods that do not fit the life you are actually trying to build.